my usual mustard on the current market situation 31.7.10
Hello,
yes, that was for me a surprisingly good month for equity markets, which is, come to an end, I must admit. He was certainly unusual, mainly because he did not fit into the typical on Risk (vs. Risk-off), and reflation (vs. deflation) trade scheme. The stock markets rose, but the same applies also to the world "safe" government bonds. be seen most clearly in the U.S., where the yield on the 5-year Treasuries (green, in%, left scale) on Friday since after the GDP figures at their lowest March 2009 were, who were the 2-year one week before ever fallen to an all-time low. Stock markets and bond yields, which are related since 1998 clearly positive, here last month went in different directions. While the bond markets have been moved by the most negative macro numbers, it was a positive season, which drove the stock markets.
In Europe, the situation was similar. While the Bund futures contract lost by a weakening of PIIGS crisis and after a very strong IFO figures (the latter I think, however, see Chart 3 July at the bottom, IFO to ISM,
http://franzlischka.blogspot.com/2010 / 07/mein-ublicher-senf-zur-aktuellen.html ., Usually for a trailer of the U.S. figures) If you look at in the inflation swaps (euro area) is priced in inflation, one sees a similar picture:
Also in the bond market moves more to the Deflation rail. The break-even rate in the 10-year sector (blue, in%, right scale) has fallen to a level that was achieved even in the financial crisis for a few days.
Who now has right to the stock or the bond market? Both? That would mean a return to the Goldilocks scenario of the 90s (high, but not to strong growth with falling inflation and increasing company profits). I can not imagine the best of intentions. I would be multiplied by the Bond Markets. The stock market has benefited from the quarterly earnings season, the first looks back (again 2nd quarter), and secondly has now passed its peak. In the future, so that the economic figures are not only on the bond, but also to the equity markets are important. The fact that S & P 500 and Euro Stoxx 50 are now both times failed in their 200-day lines, the level was also at the same time the previous motion from the June high, is there to mention also negative. Well, let's see. On Monday's is the ISM numbers already exciting.
more than a glance the current value of the commodity markets. While the chart provides the most economically principal raw material, crude oil, currently completely boring from. But otherwise does a lot. As would be one gold, the opposite of almost all assets currently has (but in line with falling inflation expectations in the bond market) breached its upward trend since 2008 to bottom has
surprised me, however, the onset of the industrial metals, especially of copper on a near 3-month high. Not quite match the rather weak economic situation. Would interpret the time being but not too much into it. Copper is for any reason, in July, usually very strong:
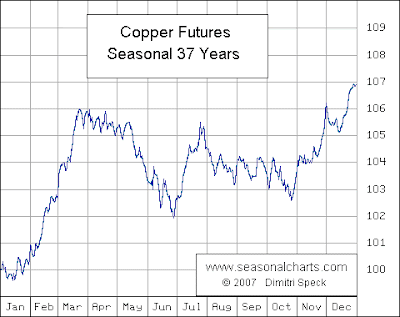
The annual change in the copper price has thus also changed little. Moreover, the economy is lagging behind on occasion:
was watching the price of copper more times, but no big draw conclusions.
may be crucial is in the immediate future of the agricultural market. And since the less hyped in the media corner the cocoa market, where does in reality the last few weeks hardly anything. More important to the wheat market, exploding the moment after the catastrophic crop failures in Russia:
could well represent a significant development. Jim Rogers and Marc Faber have long been advised to purchase agricultural commodities, due to negative Roll-process yields is not a long-term investment. Could be, however, that many people now jump on the trade. This reminds me a little of the Spring 2008: An uncertain economic situation looks, too much cheap money, the non-cyclical returns, meets crop failures. Back then it was mostly rice and crop failures in Asia, this time just wheat and crop failures in Russia and Ukraine, but even before that in China. The outcome at the time: Exploding agricultural prices, especially rice and very serious unrest in many Asian countries. Do not know if it will be similar this time, but Jim Rogers and Co have been warning for more of a mismatch between supply and demand for food, and turn on rice, but this time it is (still) not affected by price increases.
Well, let's see. If at least one potential new flashpoint. I would guess that in the near future a lot of money will flow in agricultural commodity futures. If there is strong price increases, which would create inflation in the emerging markets, whose consumption basket is dominated much more by food to fuel than in Western countries, and attract a much tighter monetary policy by itself. That could stifle the emerging market boom again. No idea if it happens. Could I but imagine. 2008, we had just before such a similar situation. And so
until next time!
Greetings
Franz
Saturday, July 31, 2010
Sunday, July 18, 2010
Black And White Wrapping Paper Designs
my usual mustard for current market situation 18.7.10
Hi, hold me once again very shortly.
My comment on the last 2 weeks: Once again, a real short squeeze. The 6 trading days in a row in which the S & P 500 were increased, exactly the time in which the calendar showed the main U.S. macro data, a large hole. Was exactly the time between the lousy Non-Farm Payrolls on 2 July and the same lousy Retail Sales 14 July. Thus, there was no bad news at the time of the macro side, simply because there was not even any messages. (Apart from the non-manufacturing ISM, but is mostly observed in the markets hardly differs except he Manufacturing from the solid, which was not the case. Both were bad. ;)
Well, the company's results surprised positively, but first, these are dated 2 Quarter and say nothing about whether the U.S. economy in the 4th Quarter will once again stuck in a recession or not. And secondly, the expectations were revised down in the run ever so strong that the obstacle could be skipped from the state.
interesting chart from Bespoke:
change in earnings estimates right scale
( http://www.bespokeinvest.com/thinkbig/2010/7/15/earnings-season-stats.html ):
But currently is dependent as much money Assessment around that the absence of any positive momentum and worse Nahrichten immediately lead to a buying frenzy. Well, the bad news to come but now again. The macro calendar is filled to the brim again since Wednesday. Retail Sales, Philly Fed, Empire State index and consumer confidence. Everything for the ton. Starting next week, then the monthly housing data and I hope to give them hardly any positive surprises. The mortgage applications fell last week on a new 14-year low. Since the end of the tax credits goes here's all downhill.
only positive message of last week came from the initial claims, which fell to its lowest level since the financial crisis. Problem is that you are very in this season with caution. Reason is the seasonal adjustment of the data. In early July, it comes every year in the U.S. auto industry to mass layoffs during the summer months. (If in the U.S. for the company appear more favorable as operating holidays). This effect is of course compiled. Since then, gives the U.S. auto industry in 2008 in their major crisis slid it in this industry now, however, significantly fewer workers. And that means less people will be laid off in early July. The statistician of the U.S. Department of Labor but use much longer back data over-estimate for the seasonal adjustment and thus the seasonal effect. Results: Since 2008 is early July, each seemingly a sharp decline in initial claims, the end of July but turns back. (Arrows below: Juli08 and Juli09)
So next week I'm plenty pessimistic (which is no surprise, perhaps;). The positive momentum is back from the market, real estate professionals are likely to be rather worse than expected (especially the Existing Home Sales on Thursday) and the second last week of July is historically the stock market anyway one of the weakest of the year (for whatever reason).
And that's it again.
Until next time!
Greetings
Franz
Saturday, July 3, 2010
Bruises On Legs Toddlers
my usual mustard on the current market situation 3.7.10
Hi, I'm back again to my Gloom & Doom Report.
Sorry, but enjoyable I can not report reliably. The S & P this week at 1040, the major neck broken through the line (even a little shaky) SKS-Formation on Friday and then formed a Death Cross still (50 - to 200-day line). Technically the chart looks really bad.
In the USA, the "R-word" back into fashion, ie recession. The main reason is the Weekly Leading Index of Economic Cycle Reseach Institute (ECRI), which I've used the last time, even more often. Respectively. more precisely the problem identified by the ECRI growth rate, a somewhat peculiar "smoothed 6-month changes Derse rate" is (exactly speaking, there is the 1-month average compared to the 12-month average; sounds sillier than it is: The time series is thus neither unique nor particularly outlier prone to base effects). Well, at any rate is the so-determined "ECRI Weekly Leading Index Growth" (green line) now fallen to such an extent as in the past just before recessions. And since this indicator was previously a very good, many are now nervous. Looks really bad, admittedly from:
For all who are interested in more detail: a little smarter now I am regarding the ingredients (which may be a little on assumptions and a more extensive Google-research, ECRI is something to cover). There are three market factors and 3 macro-economic time series: first
Stock prices, ie S & P 500 or the like (yes, which of course is debatable whether one should use it)
second Credit spreads (presumably the spread between AAA and BBB-bonds based on Moody's time series)
third Industrial metals (because they use a proprietary index, but the size differences between the indices are not already)
4th Mortgage Applications (the MBA Purchase Index series, which I also always use is. According to my regression, the most important indicator of the unique and the reason why the index time series (not the growth rate) since 1990 so strange to "shake" begins. This ZR's only since then, so the index is calculated from 1990 inevitably different than before)
5th Initial Claims (the second most important input, according to my analysis)
6th the money supply (M2 probably the weekly time series)
Another interesting leading indicator, I've just found. That means I got it from an article on dshort.com, one of my favorite sites at present:
http://dshort.com/articles/Consumer-Metrics-Growth-Index.html
The Consumer Metrics Growth Index is calculated from daily consumer surveys regarding the willingness to buy in discretionary consumer spending, so not everything for daily needs is (car, travel, etc.).
Here Website: http://www.consumerindexes.com/
and explanation: http://www.consumerindexes.com/faqs.html
Well, again the same message: The U.S. is facing a new recession. By the way, while the U.S. advertise worldwide for economic programs, they fail to mention that expire by the 01.01.2011 (issued only temporary) tax cuts from the era of George W. Bush, which will lead to a huge tax increase. Not exactly conducive to consumption. Otherwise
were mainly the real estate markets good for a lot of bad news. New Home Sales and Pending Home Sales at All-Time Low. Get a brief digression: The Tax Credit's were for purchases, the contract was signed until the end of April, for the remainder (land registry, if so what is in the U.S., etc.), there is time to end of September. In the New Home Sales is one of the contract, on Existing Home Sales, however, the entire process. The equivalent here is the Pending Home Sales, which are therefore at 1-2 months ahead. Ie New and Pending Home Sales in May were already ex-Tax Credit, which is why so terribly bad. For the Home Sales Eisting the crash is still, to see
go: the original Deadline of the tax credits last fall.
The weekly mortgage applications still show no signs of recovery, so we should stick to the sales at that level. Without state assistance at this price level there's hardly any buyers. Without question this will have consequences on the price development. And that bodes well for the stock market no good:
When I completed but still wants to find a few positive words, think about that the U.S. Immobileinmarkt may now so fast is going down, that we are already beginning could in 2011 the ground. But then really a very good deal lower than now. Buckle up!
And another thing: The last days and weeks the market appears believes to be the economic slowdown concerns especially the U.S., the strong is U.S. dollar based, Europe is in better (hence the outperformance of the european indices in local currency and thanks again. stronger euro is clearly on a uniform currency basis). Dream on! The U.S. has always had a slight lead of a few months in the economy (only exception: In the early 90s after the special situation in consequence of German reunification). The upcoming recession is probably a few months later, also with us:
So, that's it. This time, annoying "thanks" of a Cold despite perfect swimming weather. For the rest of the summer, my motivation to keep writing but probably limited. Complaints to the Salt Office. Does not matter anyway. The next month I will probably not be the cops anyway. And so until next time!
Greetings
Franz
Subscribe to:
Posts (Atom)